Dashboard
Kianda dashboards deliver a convenient way to provide insights into how your business processes are performing. Kianda dashboards offer easy reporting, permissions management, quick build, condition-based filtering and many more features.
From lists to tiles, filter and charts, dashboards allow you to build full digital experiences to monitor your real-time processes in a few minutes. To learn more about dashboards go to Dashboard pages.
Creating a Dashboard
-
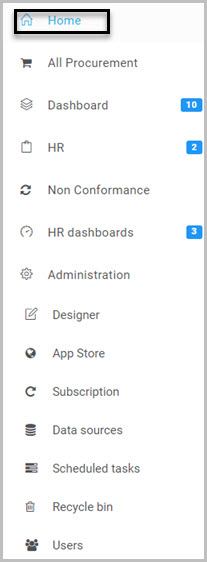
In the left-hand side menu click on Home.
-
On the top right-hand side menu click on the plus
 to add a dashboard.
 -
Change the Title to Inspection Dashboard.
-
Click on OK on the Create dashboard page dialog box.
-
Creating the Inspection dashboard will automatically bring you to a blank dashboard creation page.
Creating a List Widget
In this example we will use a List widget to keep track of all instances of our Inspection Processes. We will add the Status field from the Request From to the list to keep track in what stage is a particular process.
-
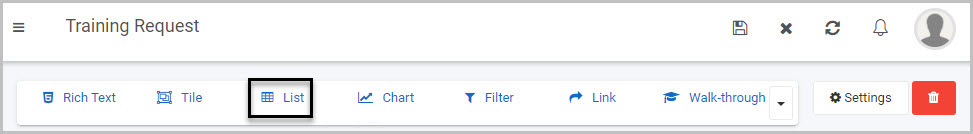
On the dashboard creation page, click on List in the top menu.
-
In the Add widget dialog box, change the Title to Inspection records.
-
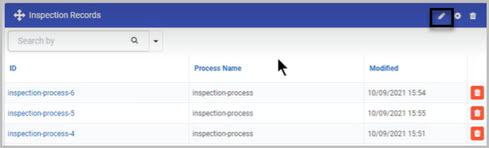
List widget automatically shows all records of all our processes in the system. We need to select the Inspection Process. Click on the pen icon on the Inspection Records.
-
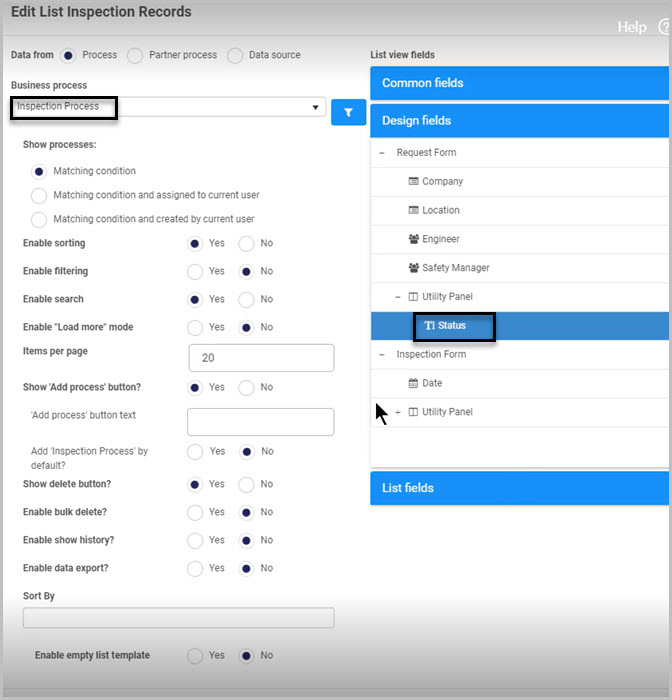
In the Edit List dialog box, select Inspection Process in the Business process option.
-
On the right-hand side of the Edit List dialog box click on Design Fields.
-
Select Status field from the Request Form.
-
Click on OK in the Edit List dialog box to save changes.
Creating a Link widget
In this example we will use the Link widget in our dashboard. By clicking on it, our users will be able to create new instances of the Inspection Process starting in the Request Form. To learn more about Link widgets go to Link widget
-
On the dashboard creation page, click on List in the top menu.
-
In the Add widget dialog box, change the Title to Request an Inspection.
-
Click on OK in the Add widget dialog box.
-
We need to activate which process to start when clicking on the link, click on the pen icon to edit the Link widget
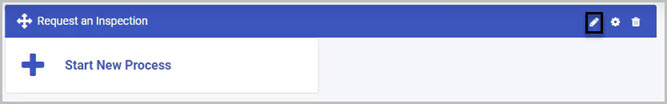
-
Click on Start New Process in the Edit button links dialog box.
-
In the Edit buttons links Request an Inspection dialog box select Inspection Process in the Target process option.
-
Click on OK in the Edit Link dialog box.
-
Click on OK in the Edit buttons links Request an Inspection dialog box.
Creating a Pie Chart widget - Pie chart
In this example we will use the Chart widget in our dashboard. We will create a pie chart from the available options, representing the status of our inspection processes. To learn more about Chart widgets go to Chart widget.
-
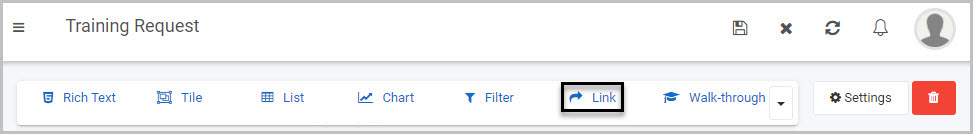
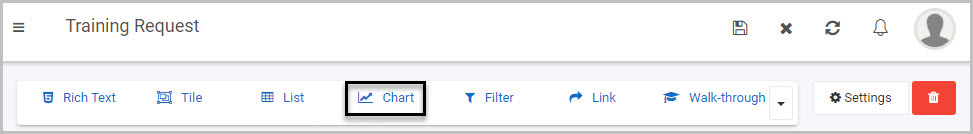
On the dashboard creation page, click on Chart in the top menu.
-
In the Add widget dialog box, change the Title to Inspection Status.
-
Click on OK in the Add widget dialog box.
-
We need to attach a process to the pie chart, click on the pen icon on the chart widget to edit it.
-
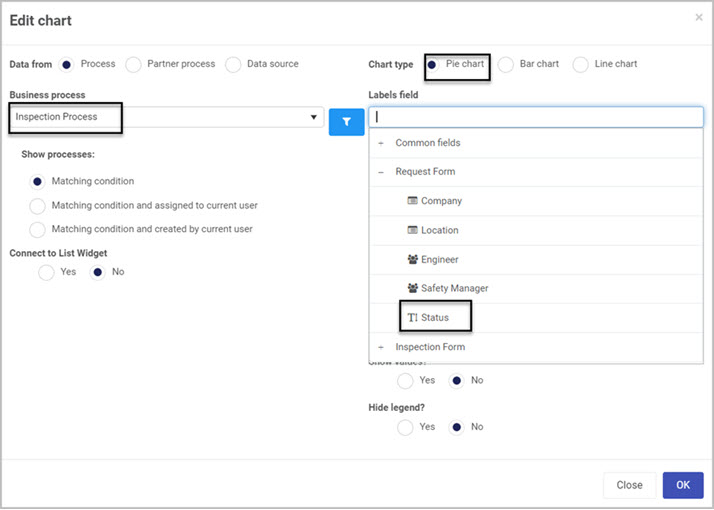
Select Inspection process in the Business process option.
-
Select Pie chart from the Chart type option.
-
Select Status field from the Label field option.
-
Click on OK in the Edit chart dialog box.
-
In the top right-hand menu click on
 to save your dashboard.
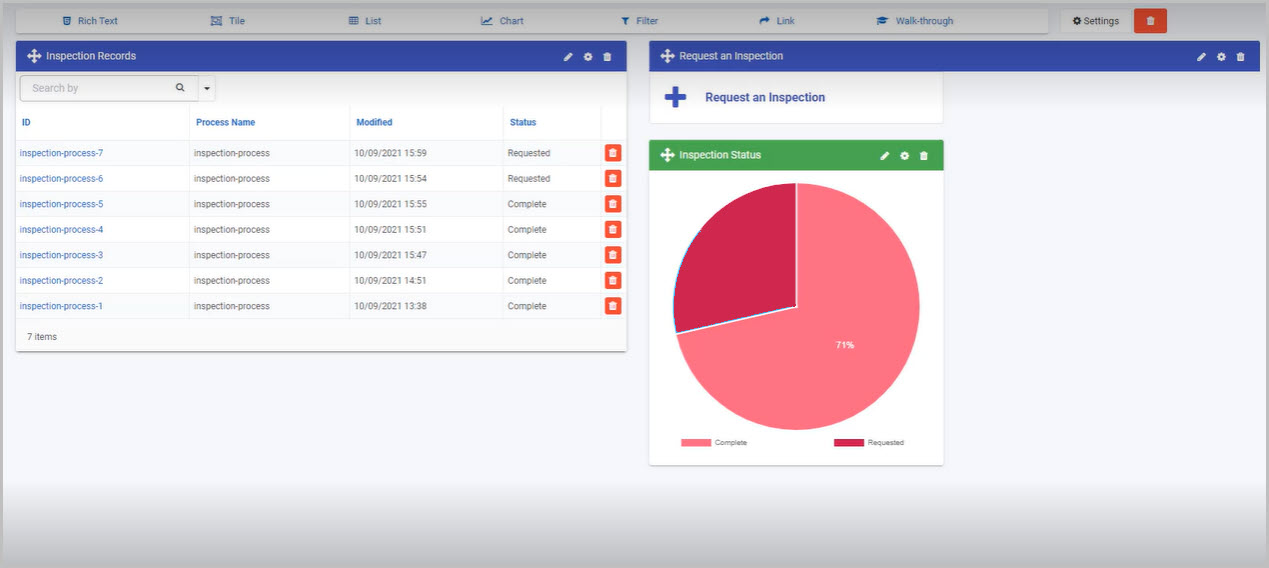
Inspection Process Dashboard Summary
We have now created the dashboard for our Inspection process. Using the List widget, we can see all details of all instances of each inspection process that was created. By picking the Status field to show in our List widget, we can see which processes are Completed and Requested. With the Link widget we are allowing the users of the dash board to click on the link to start an Inspection process. Take a look at the finished dashboard for the Inspection Process below.
Feedback
Was this page helpful?
Glad to hear it! Please tell us how we can improve.
Sorry to hear that. Please tell us how we can improve.