Dashboards
Kianda provides customisable dashboards for reporting, delivering a convenient way to provide insights into how your business processes are performing. Kianda dashboards offer easy reporting, permissions management, quick build, condition-based filtering and many more features.
From lists to tiles, filter and charts, dashboards allow you to build full digital experiences to monitor your real-time processes in a few minutes.
There are 3 steps involved in creating a dashboard:
- Create a dashboard page.
- Add one or more widgets.
- Configure or edit the widgets to make the page look the way you want.
If you are using Kianda predefined processes from the App Store or other imported processes, then dashboards have already been created for you! These are available by clicking on Dashboard from the side menu.
Before you begin it is important to be aware that there are two modes involved in dashboard pages, an Edit mode and View mode as described below.
Edit mode and View mode
When using dashboards there are two modes: Edit mode and View mode.
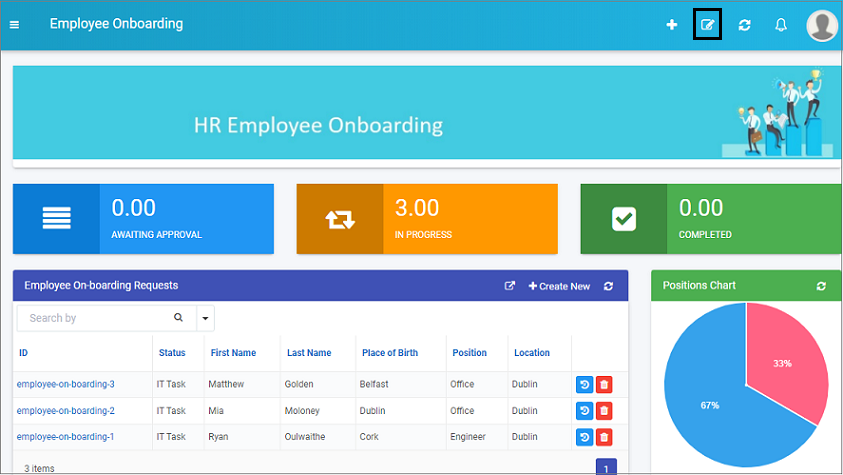
When you are in View mode, the Edit button  will be visible in the top menu bar.
Clicking on the Edit button to go into Edit mode
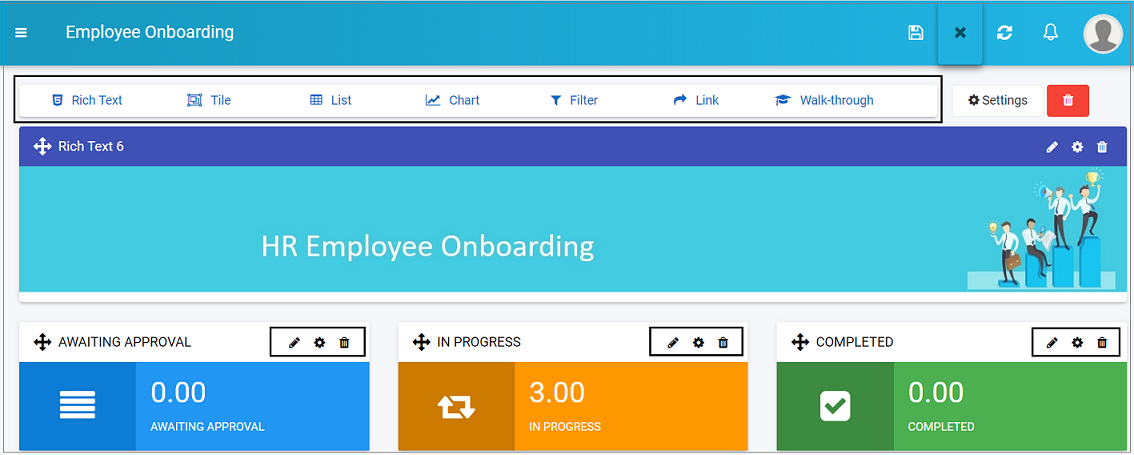
When you click on the Edit button you will be in Edit mode, which means that the Widget menu is available at the top of the dashboard page, along with the Settings button  to make changes to the page, and Bin/Trash button
  to delete the page.
Edit mode
In Edit mode, you can also make changes to widgets s Update configuration  , Settings
  and Delete
  buttons, will be available. If you want to create a dashboard page from scratch go to How to get started or if you want to learn more about dashboard widgets go to Dashboard widgets.
How to get started
Kianda offers a user-friendly interface to create dashboards in a few minutes. Please follow the below video to learn how to create dashboards.
Dashboards introduction
-
To create a dashboard, go to Home
 in the left-hand pane and click on Create a new page icon
  .
. -
A Create dashboard page dialog box opens.
Create dashboard page dialog box
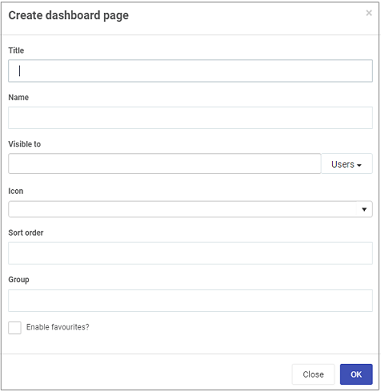
Choose from the edit options:
- Title - dashboard title for example Training Requests
- Name - this is a unique name for the dashboard
- Visible to - determine who will see the dashboard, choose from a) Users b) Groups
- Icon - click on the arrow to choose from hundreds of icons to attach to your dashboard
- Sort order - choose a numeric value to sort on by click
- Group - define a group who will use this dashboard, for example HR managers
- Enable favourites checkbox - tick this checkbox if you want to enable this dashboard as a ‘favourite’
-
Click on the OK button when you are finished editing the field to save your changes or click on Close to exit the dialog box without saving.
-
The output is a menu with a number of widgets available that you can add to the dashboard. Go to Dashboard widgets to find out more about each widget type.
Widget menu

-
If you wish to change settings for the dashboard page, click on the Settings button
see Dashboard page settings for more details. -
If you want to delete the dashboard page, click on the Bin icon
and then click on Ok to confirm that you want to delete the dashboard page or click on Cancel if you wish to cancel the deletion. -
Save any changes you make by clicking on the Save button
 in the top menu to ensure your dashboard changes are saved and you will see a pop-up message Page saved successfully.
 -
You are now in View mode. To make further changes to the dashboard page, return to Edit mode by clicking on the Edit button
 in the top menu.
Dashboard widgets
Kianda comes with 7 predefined widgets as listed below. Using these widgets you can quickly and easily create a process dashboard in minutes. The widgets are:
-
Rich text: The Rich text is used to display some texts, links or images on the dashboards.
-
Tile: A tile is used to display a count of instances with different colour schemes. You could also add conditions to display count, for example, you could add a condition “Status” equals “In-progress”, this will display the count of instances with status “In-progress”.
-
Chart: Using a chart widget, you could create a pie chart, bar chart or a line chart. These charts could be used to represent various conditions on a process,
-
List: The list widget displays the instances of the selected process. List widget could also be used to connect with any other widget to display the filtered items,
-
Filter: The filter widget is used to filter the instances based on a field. For example, process instances could be filtered by status.
-
Link: The link widget is used to add a link to a new process, dashboard or any external sources such as SharePoint.
-
Walk-through: This widget allows you to create a walk-through quickly which could be made available to a user, group or an organisation.
When you have added one or more widgets, you can move the widgets around the dashboard page using the Drag handle button  . This is possible when you are in Edit mode, see Edit mode and View mode.
Dashboard page settings
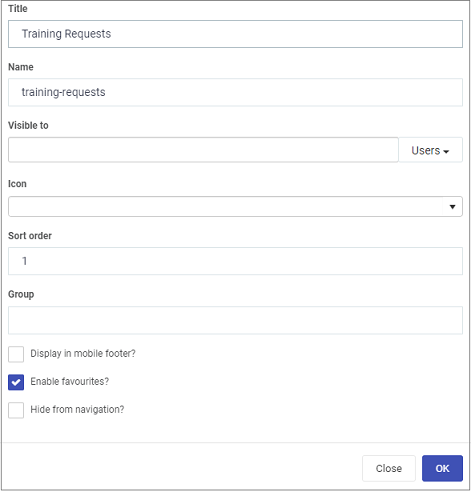
When you click on the Settings button a Page settings dialog box opens. The edit options are the same as Create dashboard page dialog box that appears during page creation, see How to get started but also includes two additional checkboxes:
-
Display in mobile footer - tick this checkbox if you want to display dashboard in the mobile footer
-
Hide from navigation - tick this checkbox if you want to hide the dashboard from navigation
Page settings
Click on the OK button when you are finished editing the field to save your changes or click on Close to exit the dialog box without saving.
Enabling data export from dashboards
Kianda allows the users to export the data from the dashboards on a simple click. To set up the configuration to export the data from the dashboards, please follow the below.
Enabling data export from dashboards
Offline availability
Kianda is a progressive web application. This enables Kianda dashboards to provide insights to the business processes even in offline mode.
For example, this can benefit businesses where users can carry out inspections or maintenance even at a remote location with no access to the internet.
What’s next 
If you would like to see examples of ‘how to’ perform particular tasks in Kianda, click on the link below:
To return to the previous pages click on the links below 
Feedback
Was this page helpful?
Glad to hear it! Please tell us how we can improve.
Sorry to hear that. Please tell us how we can improve.