Dashboard pages
Kianda dashboards deliver a convenient way to provide insights into how your business processes are performing. Dashboards offer easy reporting, permissions management, quick build, condition-based filtering and many more useful features.
From lists to tiles, filters and charts, dashboards allow you to build full digital experiences to monitor your real-time processes in a few minutes.
There are 3 steps involved in creating a dashboard:
- Create a dashboard page.
- Add one or more widgets.
- Configure or edit the widgets to make the page look the way you want.
This page covers how to create, edit, and delete dashboards and give an overview of how to add widgets to a dashboard page.
If you are using Kianda predefined processes from the App Store, then dashboards have already been created for you! These are available by clicking on Dashboard from the main side menu or left-hand pane.
Before you begin, it is important to be aware that there are two modes involved in dashboard pages, an Edit mode and View mode as described below.
Edit mode and View mode
When using dashboards, there are two modes: Edit mode and View mode.
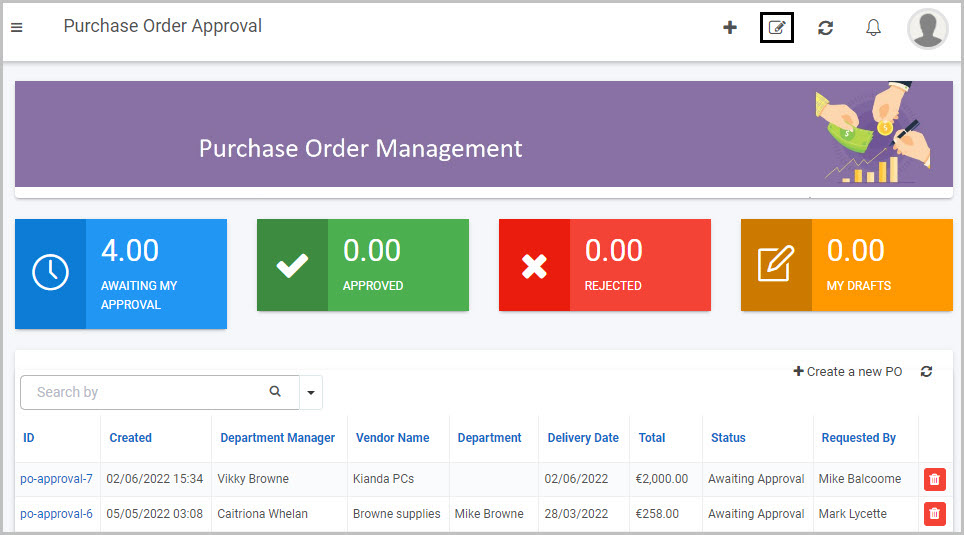
Dashboards View mode
When you are in View mode, the Edit button  will be visible to the right in the top menu bar.
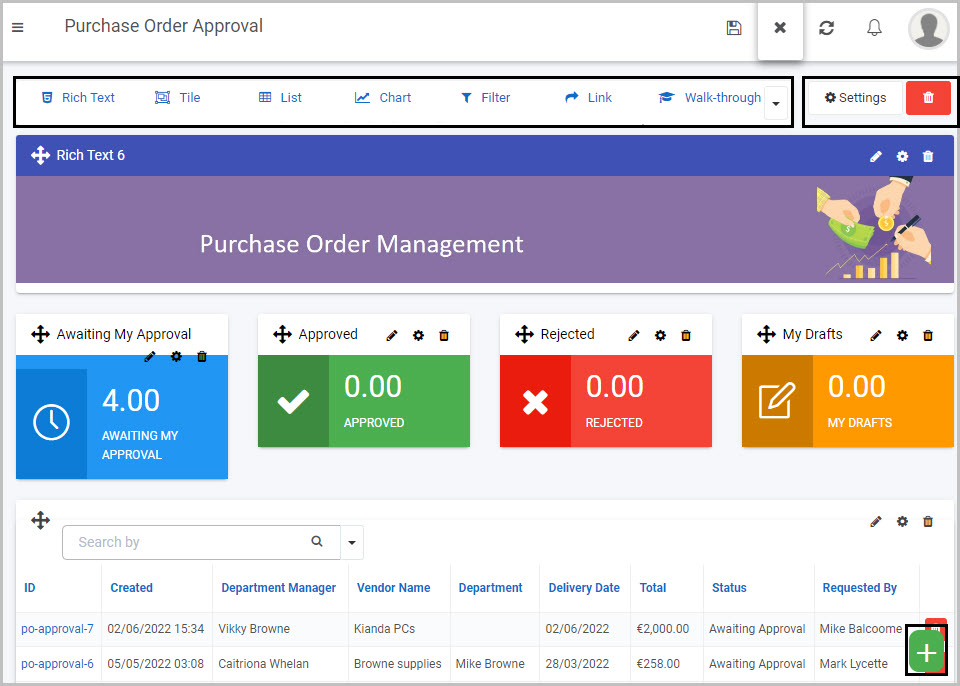
Dashboards Edit mode
When you click on the Edit current page button you will be in Edit mode. When you are viewing a page in Edit mode, these options will be available to you along the top of the dashboard page:
- the Widget menu where you can insert any of the seven available dashboard widgets
- the Settings button
 to make changes to the dashboard page
 - the Bin/Trash button
 to delete the dashboard page
 - the Add layout container button
 to add a layout container to the dashboard page in order to organise the widgets on the page and achieve the layout you want
 - three buttons
 on each widget on the dashboard that allow you to edit the options relating to that widget type (Update configuration), edit the widget settings (Update widget settings) or delete the widget from the dashboard (Remove widget)
If you want to create a dashboard page from scratch go to How to create a dashboard page or if you want to learn more about dashboard widgets go to Dashboard widgets.
How to create a Dashboard page
Kianda offers a user-friendly interface to create dashboards in minutes. This video covers the steps for creating a new dashboard:
To create a new Dashboard page:
Click on Home
 in the left-hand pane
Click on the Create a new page icon

A Create dashboard page dialog box will open, allowing you to choose from a range of options for your new dashboard page:
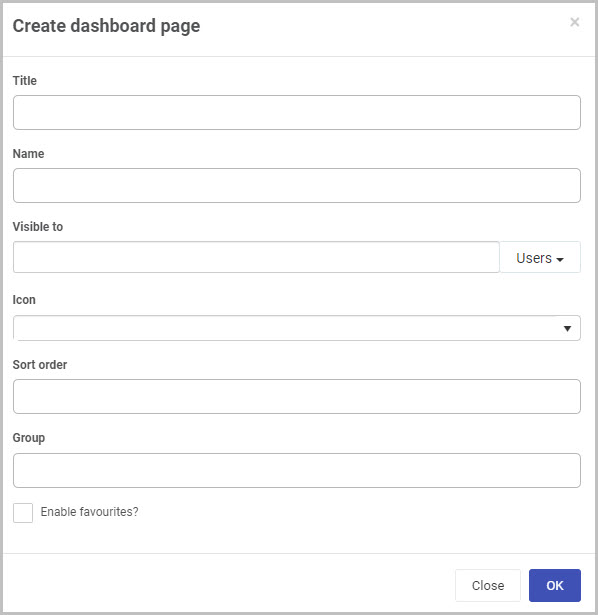
The options in the Create dashboard page dialog box include:
Title - The title of the dashboard page. You can insert whatever title you want - for example, ‘Training Requests’.
Name - This is a unique name for the dashboard.
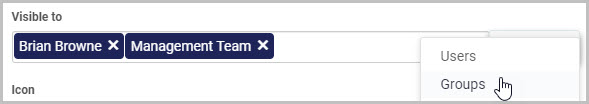
Visible to - You can decide who will be able see the dashboard. You can select single or multiple users or Groups or a combination of the two (as shown here):
Note: Levels of Security
Dashboard-level security can only be applied if you are an Administrator and can set the visibility of dashboards and widgets. The dashboard page-level security you are setting here - who can see the dashboard page - will override any security you set for the visibility of individual widgets on that dashboard. See Dashboard security and Widget security for more information.
Widget security: You will also be able to set security for each of the individual widgets that you add to the dashboard, i.e. who can view each dashboard widget.
Icon - You can choose an icon for your dashboard page from a drop-down list of hundreds of available icons.
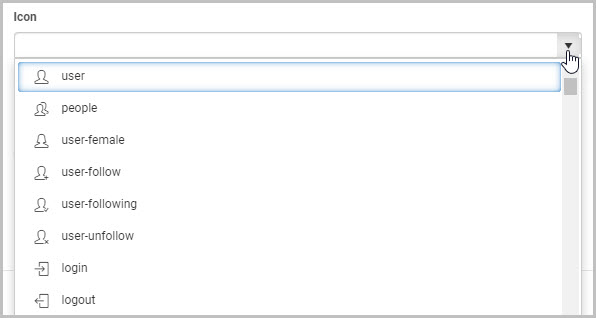
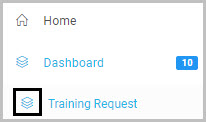
The icon you select will appear next to the dashboard title when you click on Dashboard in the left side menu to view all of the available dashboards:
Sort order - Choose a numeric value - by either typing it into the field or by clicking on the up down arrows at the right of the field
 - for the place you want this dashboard to go in terms of the order of the dashboard pages in your main left side menu.
Group - You can choose to group this dashboard as a sub-page of an existing dashboard page. If you want to do this, insert the name of the dashboard page you want to group this new dashboard page under.
Enable favourites - Select this checkbox if you want to insert an ‘Add to favourites’ button to the top menu in the dashboard.
Once you complete the Create dashboard page dialog box and click OK, and then click the Save button
 in the top dashboard menu, a new ‘Add to favourites’ button will be added to your top dashboard menu:
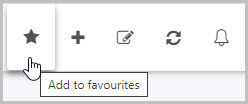
If you want to add the current dashboard to your favourites:
Click the Add to favourites button

Complete the Add to favourite dialog box that opens and then click the Add favourite button to add this dashboard to your favourites (or click Close to cancel adding it to your favourites):
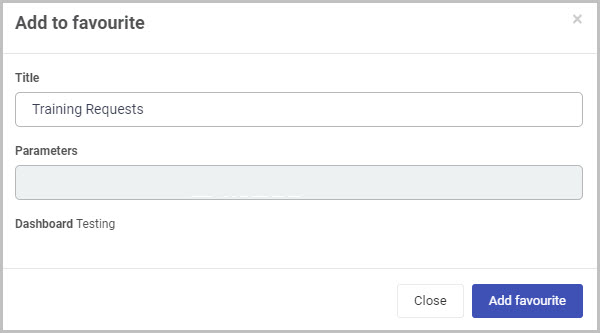
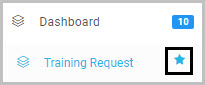
If you click ‘Add favourite’, the dialog box will close and a pop-up message will display saying ‘Favourite saved successfully’. A new star icon will now appear next to this dashboard page in the Dashboards menu in the main left side menu (denoting that it is a favourite page).
Click on the OK button when you are have completed the Create dashboard page dialog box (or click on Close to close the dialog box and cancel the creation of the new dashboard page).
The output is a menu with a number of widgets available that you can add to the dashboard.
Note: To add a widget to a dashboard, simply click on the widget type from the widget menu when you are in Edit mode. See How to add layout containers to a Dashboard page and How to add widgets to a Dashboard page to learn more, and go to Dashboard widgets to find out more about each widget type.
Click on the Save button
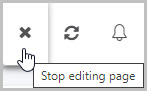
in the top menu to save any changes you make to the new Dashboard page - a pop-up message saying ‘Page saved successfully’ will display.Alternatively, if you don’t want to save the changes you’ve made to the page, click on the Stop editing page button to return to View mode without saving changes:
You are now in View mode. To make further changes to the dashboard page, return to Edit mode by clicking on the Edit button
in the top menu.
How to edit a Dashboard page
- Click on the Edit current page button to go into Edit mode.
- Click on the Settings button - see How to edit Dashboard page settings for more details.
- Click on the Save button in the top dashboard menu to save the changes to the page.
How to delete a Dashboard page
Click on the Edit current page button
to go into Edit mode.Click on the Trash/Bin icon
 .
.A Delete page dialog box will open:
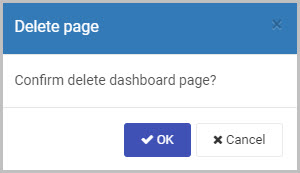
Click on OK to confirm that you want to delete the dashboard page (or click on Cancel to cancel the deletion).
Click on the Save button
in the top dashboard menu to save the changes to the page.
How to add layout containers to a Dashboard page
A layout container is a simple way to organise, arrange and move the widgets you add to your dashboard. It works in a way that is similar to how a Panel layout control is used in a form to organise the fields in a form.
To add a layout container to a Dashboard:
Click on the Edit current page button
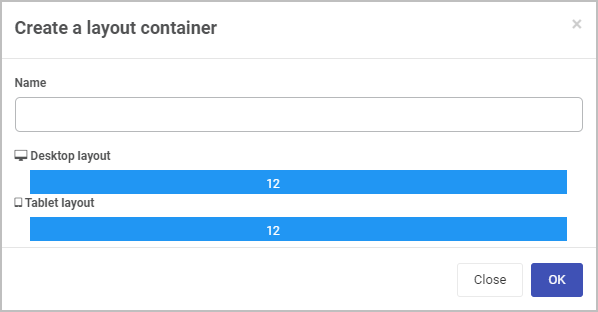
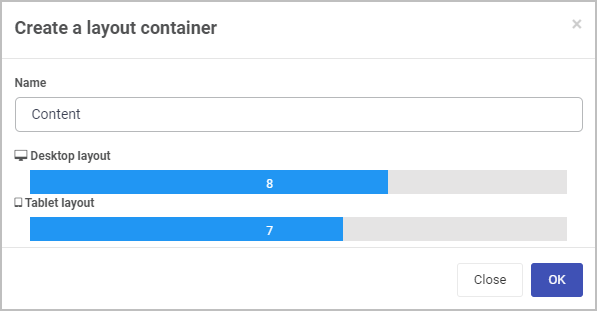
to go into Edit mode.Click the green Add layout container button
at the bottom right of the dashboard page.Complete the Create a layout container dialog box that opens by inserting a name and then selecting the width you want for the layout container (by selecting how wide the blue bar is):
Note:
If you know the layout you want for your Dashboard, in terms of what widgets you want to put where, and how large you want the various widgets to be, insert layout containers before you start adding widgets to your dashboard page. Then, when you insert each widget, you can choose which layout container you want to assign it to when you are creating the widget.
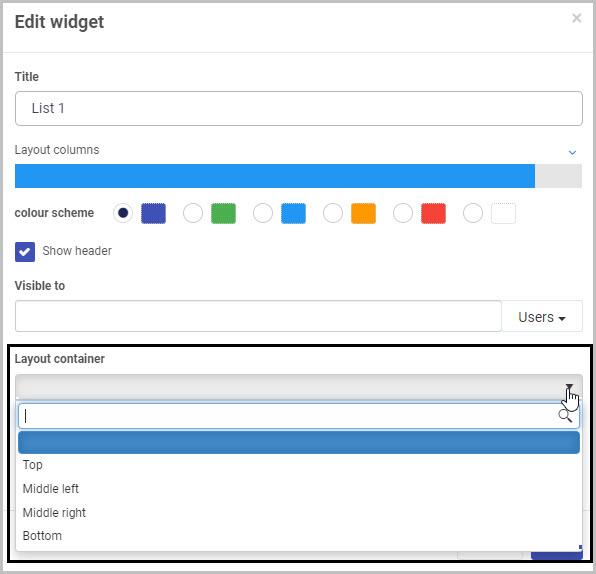
Alternatively, if you aren’t sure what widgets you are going to add or what layout you want for your dashboard, you can simply start adding widgets to your dashboard without any layout containers. Once you have added the widgets to the dashboard, you can either drag and drop the widgets to get the dashboard page layout you want or you can go back and insert layout containers and assign widgets to those containers but clicking on the Update widget settings button for each widget.
For example, for this existing widget, by opening the Edit widget dialog box, we can now choose to assign it to any of the four available layout containers:
How to edit and delete a layout container
To edit a layout container:
Find the layout container you would like to edit and click on the Edit layout container button
in the bottom left corner of the layout container.In the Create a layout container dialog box, apply any necessary changes to the fields.
When finished click on OK to confirm your changes, or click on Close to cancel your changes.
Click on the Save button
in the top dashboard menu to save the changes to the page.
To delete a layout container:
- Find the layout container you would like to edit and click on the Delete button
 .
. - Click on the Save button in the top dashboard menu to save the changes to the page.
The widgets that were previously within that layout container will then be appended to the end of the dashboard page.
How to add widgets to a Dashboard page
To add a widget to a Dashboard page:
Click on the Edit current page button
to go into Edit mode.If you know the layout you want for your Dashboard, click the green Add layout container button
to create a layout container or several layout containers. See How to add layout containers to a Dashboard page.Click on the type of widget you want to insert, from the seven available widget types in the dashboard widgets menu.

Complete the relevant dialog boxes for the widget type you have chosen. To learn more, go to Dashboard widgets and click on the widget type you want to add to your dashboard to find out more about it.
Once you have added your widget(s), click on the Save button
in the top dashboard menu to save the changes to the page.
Dashboard widgets
Kianda comes with 7 predefined dashboard widgets that you can add to a dashboard page once you are in Edit mode. Using these widgets, you can quickly and easily create a process dashboard in minutes.
To learn more about each widget type and how to add it to a dashboard, click on the name of the widget:
Rich Text widget: The Rich Text widget can be used to display text, links or images in a dashboard.
Tile widget: The Tile widget can be used to display a count of instances with different colour schemes. You could also add conditions to a display count - for example, you could add a condition of “Status” equals “In-progress” so that the count of process instances with a status of “In-progress” is displayed.
Chart widget: Using a Chart widget, you could display a pie chart, bar chart or a line chart in your dashboard. These charts can be used to represent various conditions in a process.
List widget: The List widget displays the instances (individual records) of the selected process. It can also be used to connect with any other widget to display the filtered items.
Filter widget: The Filter widget can be used to filter process instances based on a field. For example, process instances could be filtered by status.
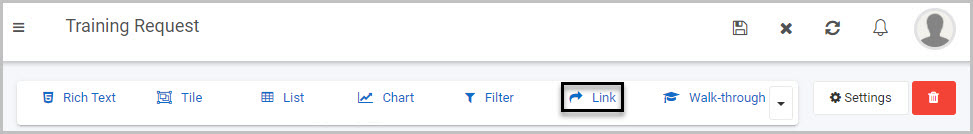
Link widget: The Link widget can be used to add a link to a new process, dashboard or any external sources (such as SharePoint or a website).
Walk-through widget: The Walk-through widget allows you to create a walk-through of a process quickly which could be made available to a user, group or organisation.
When you have added one or more dashboard widgets, you can move the widgets around the dashboard page using the Drag handle button. This is possible when you are in Edit mode, see Edit mode and View mode.
How to edit Dashboard page settings
To edit a Dashboard page:
Click on the Edit current page button
to go into Edit mode.Click on the Settings button
.An Edit dashboard page dialog box opens:
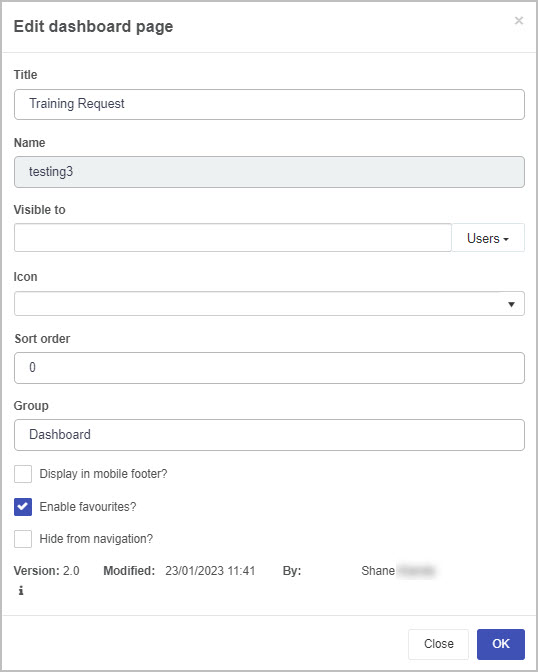
The options available are the same as those available in the Create dashboard page dialog box used to create a new dashboard page - see How to create a dashboard page - but there are also two additional options:
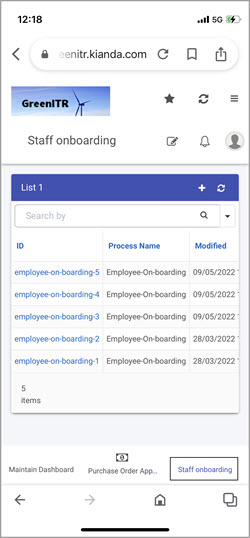
Display in mobile footer - Select this checkbox to display a link to the dashboard in the footer of a mobile phone when the Kianda workspace is accessed on a mobile. Here we can see the example of a link to a dashboard page called ‘Staff onboarding’ available in the footer of a mobile phone:
Hide from navigation - Select this checkbox if you want to hide this dashboard from the navigation in the left side menu.
Note: Selecting this option will override whatever options you may have inserted in the ‘Visible to’ option in the Create dashboard page dialog box (which allows you to restrict who can see the dashboard). Selecting Hide from navigation will mean the dashboard page will not be visible to anyone in the main side menu.
Click on the Version history information button
 to view the version history of the dashboard. This allows you to view the current dashboard version as well as all the previously saved dashboard versions, when they were modified, and by who they were saved. Clicking on the Restore page version button
  allows you to rollback to that version, which changes all the current dashboard widgets and settings to reflect the version selected. It should be noted that when rolling back to a previous version for example version 2.0 from version 5.0, you can still restore a version that succeeds version 2.0 if necessary as the version numbers are incremental.
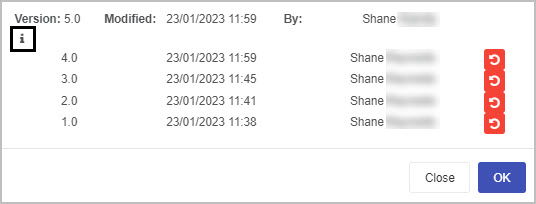
Click on the OK button to save the changes you have made in the Edit dashboard page dialog box (or click on Close to exit the dialog box without saving).
Click on the Save button
in the top dashboard menu to save the changes to the page.
Enabling data export from dashboards
Kianda allows users to export the data from dashboards with a simple click.
This video explains how to set up the configuration to export data from dashboards:
Offline availability
Kianda is a progressive web application. This enables Kianda dashboards to provide insights to the business processes, even in offline mode.
This can be beneficial for businesses with users who will need to complete forms when their device is offline - for example, a business with users who carry out inspections or maintenance in remote locations with no access to the internet. While working offline, the user can still create new process instances or carry out actions on an existing instance.
Saving changes
Make sure to save any changes you make to your Dashboard by clicking on the Save button .
What’s next 
We have briefly introduced Kianda Dashboards. Now let’s look at each of available Dashboard widgets - and Conditions that can be applied to some of them - in more detail:
Feedback
Was this page helpful?
Glad to hear it! Please tell us how we can improve.
Sorry to hear that. Please tell us how we can improve.