Filter widget
Introduction
In your dashboards you can create a Filter Widget. This widget is typically used to filter data in other dashboard widgets, for example, a List Widget, so your filter choice will influence how the list widget displays. You can use the filter to search for specific type of data within other widgets helping you to breakdown information without having to look for it manually.
You can create four types of filters:
-
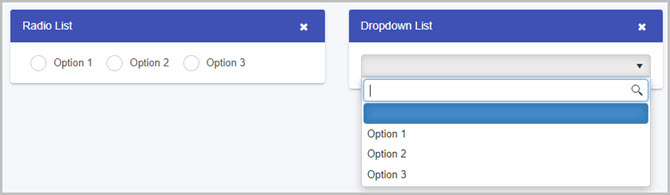
Manual/datasource filter - this filter will allow you to search for data by selecting an option which can be entered in manually or pulled from a datasource. There are two styles of manual/datasource filters: a Dropdown or a Radio list:
-
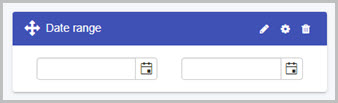
Date range filter - this filter allows you to enter two sets of dates which can be then used to filter your data based on a date input in a connected dashboard widget.
-
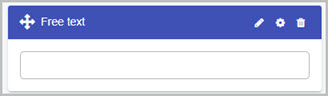
Free text filter - this filter allows you to filter data in a connected dashboard widget by typing text freely into the search bar.
Note: by default you are required to connect this filter to another dashboard widget so that the filter knows which widget your are searching for data.
-
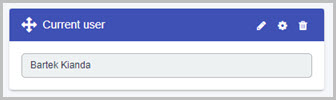
Current user filter - this filter allows you to pull a profile attribute from the currently logged in user which can be then used to filter data in another dashboard widget. For example you can pull the display name attribute from the user and based on that, you could filter data in other widgets that belong to the current user. To learn more about users and profile attributes visit Modify profile attributes.
How to get started
To add a Filter widget to a dashboard:
-
Open the relevant dashboard page. To learn how to create your first dashboard page, go to How to create a dashboard page.
-
Click on the Edit current page button from the top dashboard menu to go into Dashboards Edit mode (in which the Widget menu, Settings button
 , Bin/Trash button
  and Add layout container button
  are available):
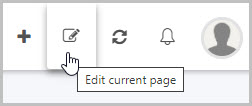
-
Click on the Filter widget button in the Dashboard Widget menu.

-
The Add widget dialog box opens with a range of options for your new Filter widget.
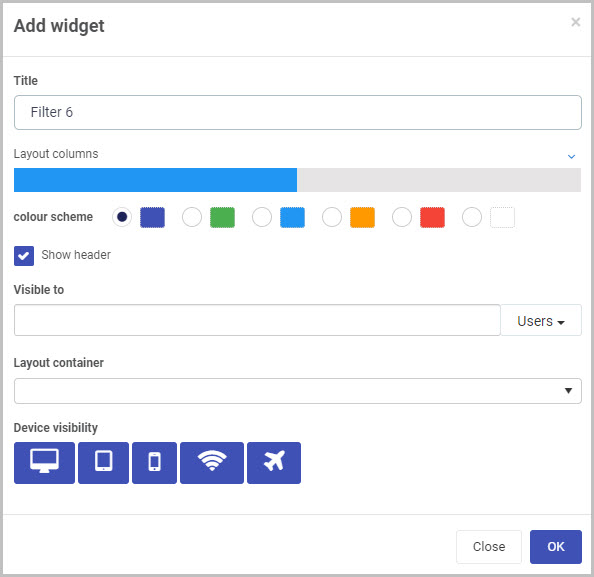
Choose the options you want:
-
Title - You can insert the title you want for your Filter widget (instead of the default title that is shown).
-
Layout columns - You can choose how wide you want your Filter widget to be. You can choose from 1 to 12 columns in width by clicking on the blue bar. For example click half-way across the blue bar to create a widget that is 6 columns wide, or click to the very end of the bar to create a column that is 12 columns wide.
-
Colour scheme - You can choose from six colour options for the header of the widget (Navy, Green, Blue, Amber, Red or White), if you choose to display it.
-
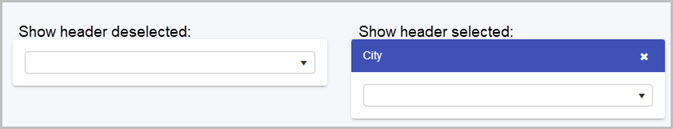
Show header - You can choose whether or not you want the header of your widget to be shown when the dashboard is not in edit mode. This checkbox is selected by default, so de-select it if you don’t want the header to be displayed.
-
Visible to - You can choose who will be able to see the Filter widget. Select single or multiple Users or Groups, or a combination of the two. You can use the menu on the right to either filter the drop-down list by Users or Groups. To find out more about pre-defined Groups on Kianda, go to Users & Groups.
-
Note - Dashboard page security: When a dashboard page is first created, the users(s)/group(s) who will be able to view the dashboard are selected in the ‘Visible to’ option in the Create dashboard page dialog box (see Step 3 in How to create a Dashboard page).
You can also edit or update this setting at any point to change who has permission to view a particular dashboard page. This higher dashboard-level security setting will take precedence over the security settings (‘Visible to’) that are applied to the individual widgets within the dashboard (such as the Filter widget, in this case).
See Dashboard security and Widget security for more information.
-
-
Layout container: This option will only display if you have already created layout containers for your Dashboard page. Here, you can select the layout container you want to place your new Filter widget in.
A layout container is a simple way to organise, arrange and move the widgets you add to your dashboard. To learn more about layout containers, go to How to add layout containers to a Dashboard page.
-
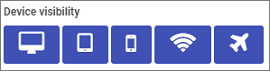
Device visibility - You can choose what devices and types of internet connections the dashboard Filter widget will be visible on - select all the options you want from Desktop, Tablet, Mobile, Wi-Fi and Flight mode as to when the device can view the dashboards. By default, all options are selected.
-
-
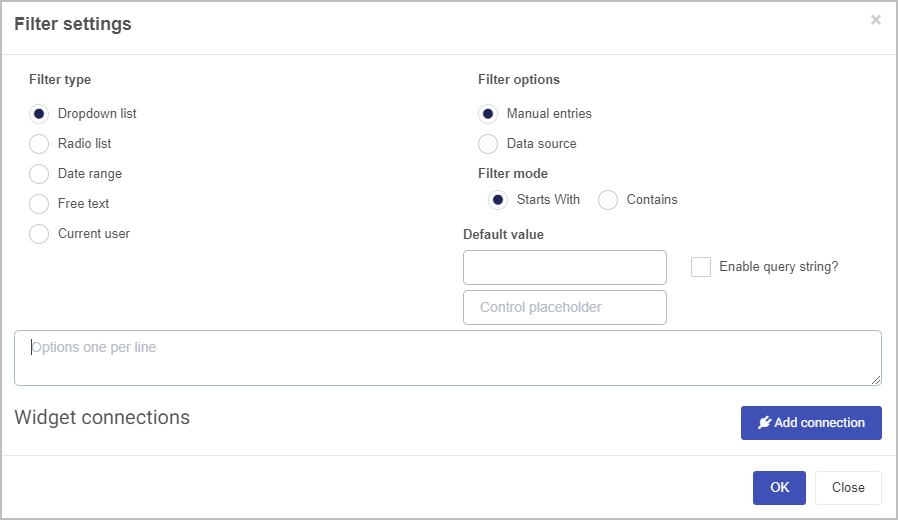
Click on OK when you’ve completed the Add widget dialog box. A Filter settings dialog will open automatically:
How to create a Manual/datasource filter
-
First, follow the steps in How to get started to create a filter widget or edit an existing filter, to edit an existing filter, see How to edit Filter widgets.
-
In the Filter settings dialog, select Dropdown list or Radio list as your Filter type.
-
In the Filter options select from:
-
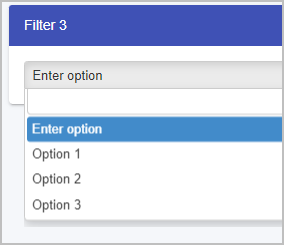
Manual entries - this option will provide you a text box in which you can specify your filter options. Each option needs to be on a separate line of the text box, see image below:
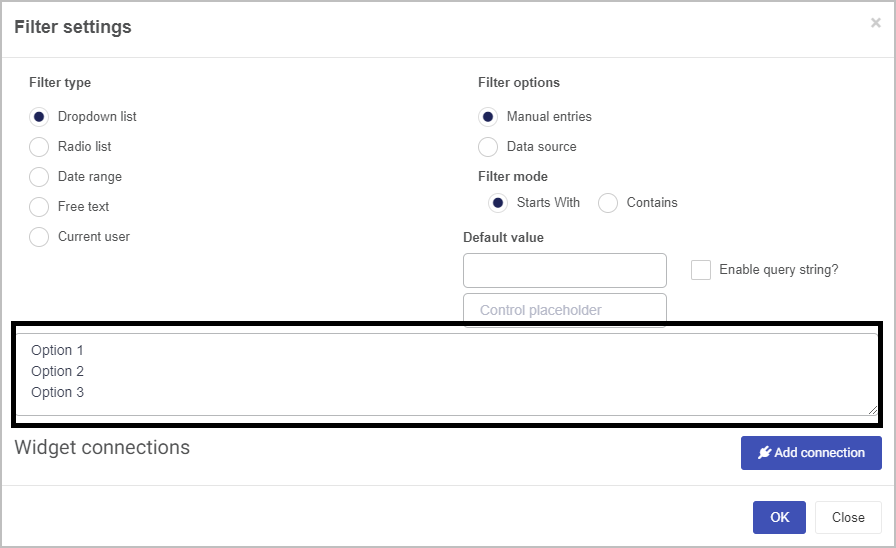
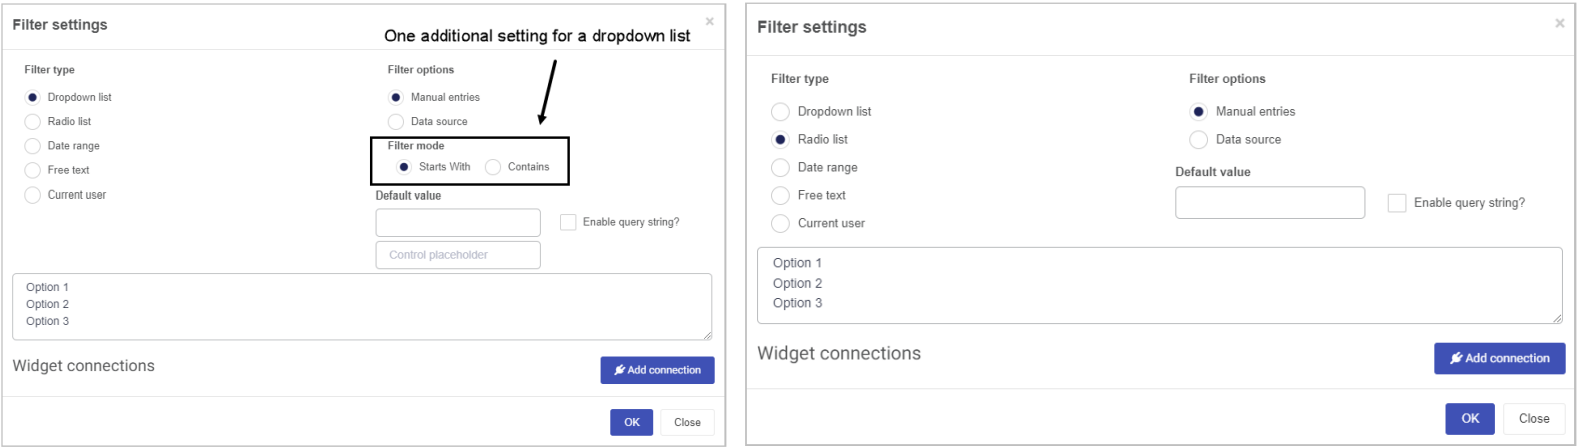
Your filter will display filter options in a different manner depending on the style you choose: Dropdown or Radio list. Dropdown list displays one additional setting (explained below).
-
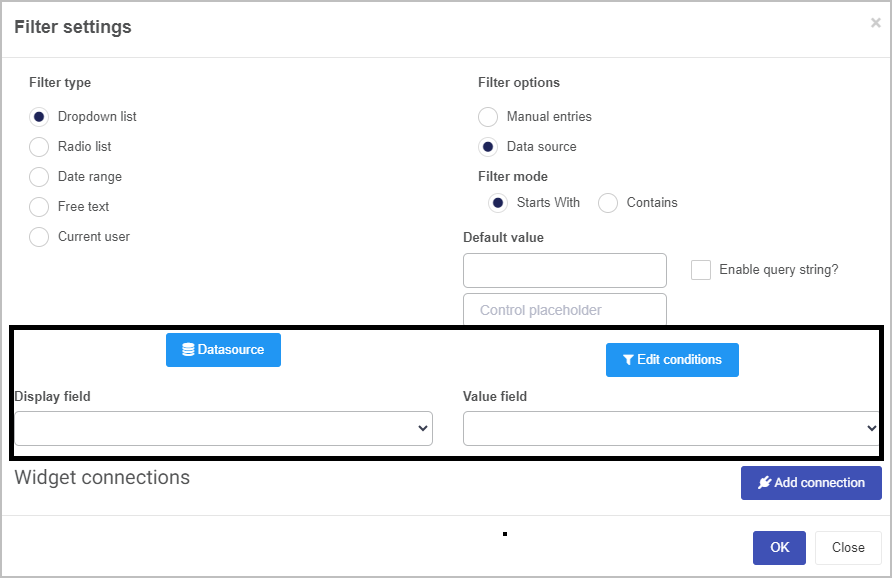
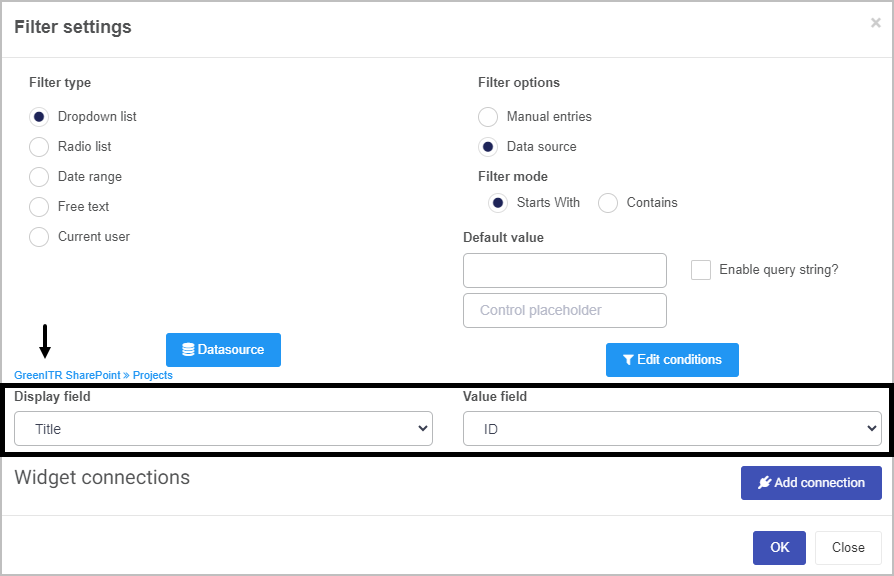
Data source - once you select this option, additional settings will appear:
-
Datasource button - this button will allow you to connect to datasource which will allow you to pull the filter options. For example, you can connect to a SharePoint list that contains all your filter options or any other datasource that has been created within your system. See Data connectors for a full list of datasources you can create.
-
Edit condition button - this button allows you to create a condition to pull data from the datasource, once the condition is matched the data will be pulled from the datasource. See Conditions to learn more.
-
Display field & Value field - Display field will be the option visible to the user while the Value field will be the actual value when the option is selected. For example, if you are pulling your filter options form a SharePoint list which has multiple columns, you can select one of those columns to be displayed for the user and use another column for the value. To further extend the example, you could have the display field set to a username (title) and in the background pull the users role as the value.
-
-
-
If you choose to create Dropdown list filter, an additional option in the settings will be required to fill out:
- Filter mode - this options will allow you to search either the beginning of a string by selecting Starts With or by selecting Contains, the filter will search if the chosen option is contained in a string.
-
You can set a default value of your filter by typing one of your options into the Default value text box. This means that whenever your dashboard is loaded, the text you enter in the Default value will be automatically set as the default option.
-
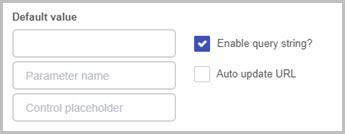
Enable query string - check this checkbox if you wish to include a query string when filtering data. When enabled, an additional textbox will appear under the Default value textbox:
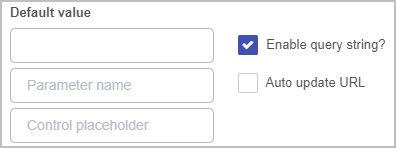
Type the name of your parameter into the textbox provided (where the place holder says “Parameter name”). Check the Auto update URL checkbox to allow the URL be updated automatically when you select an option. To learn more about query strings within Kianda, visit Query Strings and for an additional example of query strings within the Filter widget, visit Filter Widget Query Strings.
-
Control placeholder - if you select Dropdown list as your filter type, an additional text field will appear called Control placeholder. The text entered here will appear as the placeholder text for your dropdown filter.
-
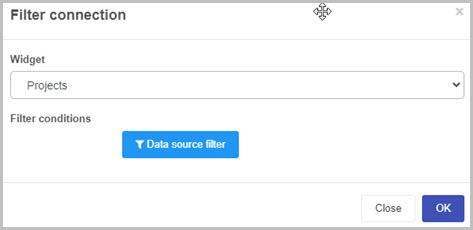
Click on Add connection to connect your filter to another dashboard widget which you want to target while filtering data based on the option selected.
-
Click on the Widget dropdown list to select an existing dashboard widget. Once a widget is selected a Data source filter button will appear.
-
Data source filter button is used to create a condition. Once this condition is met, the connected widget will then display data that matches the condition.
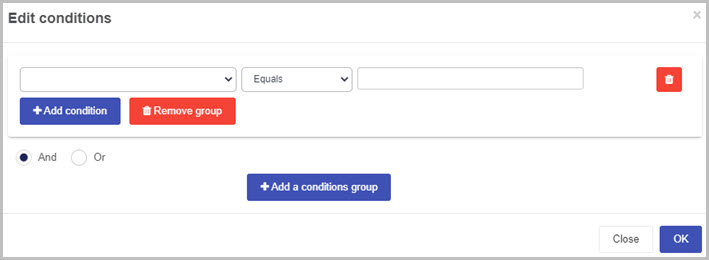
- The left dropdown is the value from the widget you’re connecting to, while the right most textbox is the value chosen in the filter.
-
-
Confirm your settings of the filter by clicking OK on all dialog boxes and click on save dashboard button to see all changes to the filter widget.
How to create a Date range filter
-
First, follow the steps in How to get started to create a filter widget or edit an existing filter, to edit an existing filter, see How to edit Filter widgets.
-
In the Filter settings dialog, select Date range as your Filter type.
-
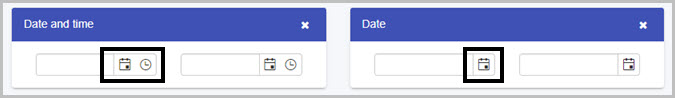
In the filter options select a Date format, once your date range filter is set up, the filter will allow you to:
-
Date - allows you to select a date from a date picker.
-
Date and time - allows you to select a date from a date picker and a time from a time picker.
-
-
Click on Add connection to connect your filter to another dashboard widget which you want to target while filtering data based on the date selected.
-
Click on the Widget dropdown list to select an existing dashboard widget. Once a widget is selected a Data source filter button will appear.
-
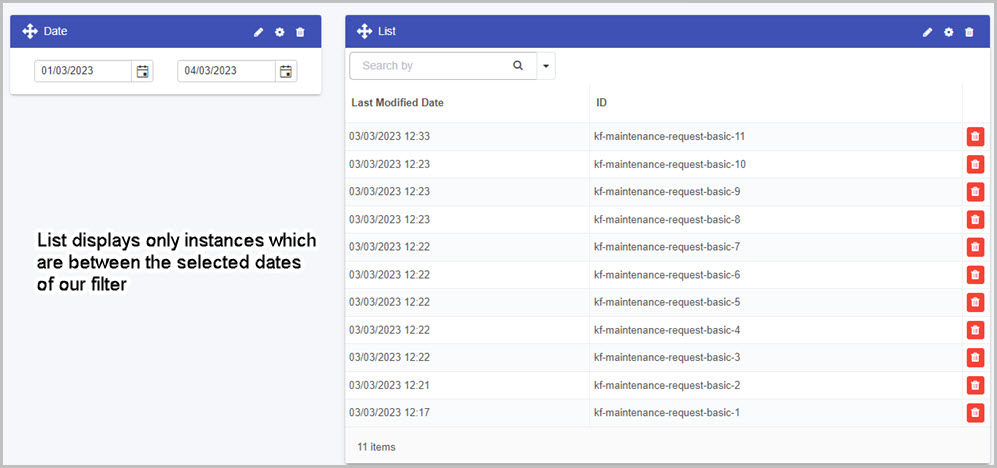
Data source filter button is used to create a condition. Once this condition is met, the connected widget will then display data that matches the condition. Note that because you are using a date filter, the widget you are targeting must contain a date value. See the below image of a condition that allows us to filter a last modified date field (available in common fields of each process instance) between the range of our two inputs on List widget which is attached to a process.
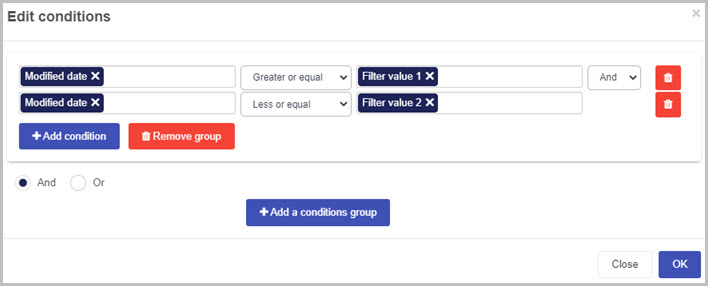
In the image below, you can see that the list only displays process instances between the dates we provided in the date filter.
-
-
Confirm your settings of the filter by clicking OK on all dialog boxes and click on save dashboard button to see all changes to the date filter widget.
How to create Free text filter
-
First, follow the steps in How to get started to create a filter widget or edit an existing filter, to edit an existing filter, see How to edit Filter widgets.
-
In the Filter settings dialog, select Free text as your Filter type.
-
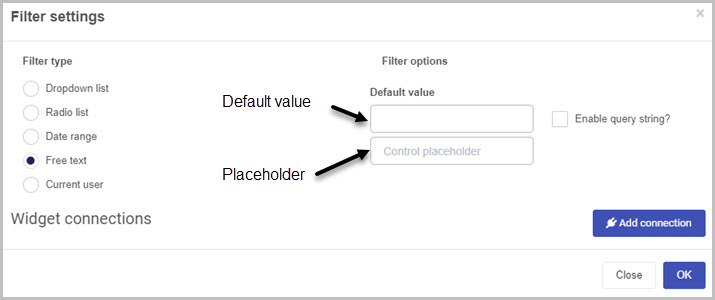
You can set a default value of your filter by typing one into the Default value text box. This means that whenever your dashboard is loaded, the text you enter in the Default value will be automatically set as the default option. If you don’t need a default value, you can also create a placeholder by typing text into the placeholder provided:
-
Enable query string - check this checkbox if you wish to include a query string when filtering data. When enabled, an additional textbox will appear under the Default value textbox:
Type the name of your parameter into the textbox provided (where the place holder says “Parameter name”). Check the Auto update URL checkbox to allow the URL be updated automatically when you select an option. To learn more about query strings within Kianda, visit Query Strings and for an additional example of query strings within the Filter widget, visit Filter Widget Query Strings.
-
Click on Add connection to connect your filter to another dashboard widget which you want to target while filtering data based on the free text provided by a user.
-
Click on the Widget dropdown list to select an existing dashboard widget. Once a widget is selected a Data source filter button will appear.
-
Data source filter button is used to create a condition. Once this condition is met, the connected widget will then display data that matches the condition.
The left dropdown is the value from the widget you’re connecting to, while the right most textbox is the free text value.
-
-
Confirm your settings of the filter by clicking OK on all dialog boxes and click on save dashboard button to see all changes to the filter widget.
How to create Current user filter
-
First, follow the steps in How to get started to create a filter widget or edit an existing filter, to edit an existing filter, see How to edit Filter widgets.
-
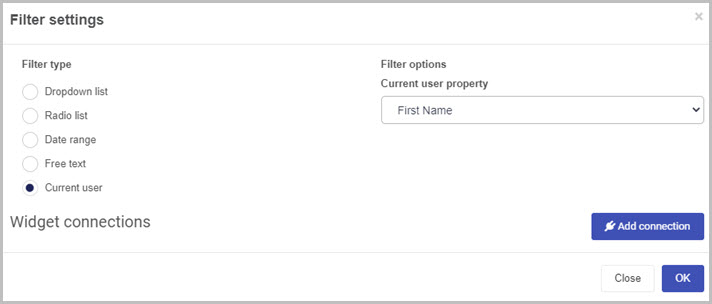
In the Filter settings dialog, select Current user as your Filter type.
-
In the Current user property dropdown list, select the property you want to extract as the value of your filter. To learn more about users and profile attributes visit Modify profile attributes.
-
Click on Add connection to connect your filter to another dashboard widget which you want to target while filtering data based on the Current user property value.
-
Click on the Widget dropdown list to select an existing dashboard widget. Once a widget is selected a Data source filter button will appear.
-
Data source filter button is used to create a condition. Once this condition is met, the connected widget will then display data that matches the condition.
The left dropdown is the value from the widget you’re connecting to, while the right most textbox is the free text value.
-
-
Confirm your settings of the filter by clicking OK on all dialog boxes and click on save dashboard button to see all changes to the filter widget.
How to edit Filter widgets
To edit a Filter widget on a dashboard:
-
In the dashboard, click on the Edit current page button
 in the top menu to view the page in Dashboards Edit mode (in which the Widget menu, Settings button and Bin/Trash button are available).
 -
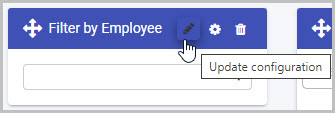
Click on the Filter widget’s Update configuration (Edit) button
 .
.
-
The Filter settings dialog box opens, enabling you to make whatever changes you want to the filter using the same range of options as outlined in Step 6 of How to get started.
-
Making the changes you want and then click OK.
-
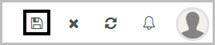
The updated Filter widget will be shown on the Dashboard. Click on Save
 in the dashboard top menu to save the changes you’ve made.
How to move Filter widgets
To move a Filter widget on a dashboard:
-
On your dashboard, click on the Edit current page button
in the top menu to go into Dashboards Edit mode. -
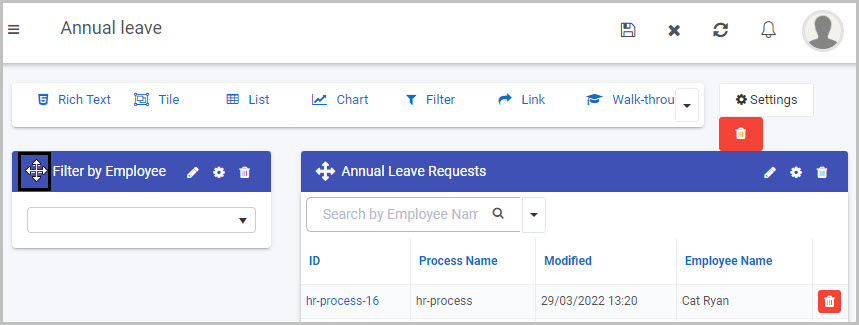
Select the widget’s drag handle button
 .
. -
Drag and drop the widget where you want it to go on your dashboard.
In our example, we could move the new Filter widget to the top left of the dashboard:
-
Click on Save
in the dashboard top menu to save the changes you’ve made.
How to delete Filter widgets
To delete a Filter widget from your dashboard:
-
On your dashboard, click on the Edit current page button
in the top menu to go into Dashboards Edit mode. -
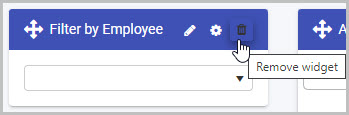
Click on the widget’s Remove widget (Bin/Trash icon) button
 .
.
-
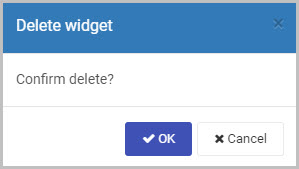
A Delete widget dialog box will open. Click on OK to delete the widget (or click on Cancel if you wish to cancel the deletion).
-
Click on Save
in the dashboard top menu to save the changes you’ve made.
How to edit Filter widget settings
To update or edit your Filter widget settings:
-
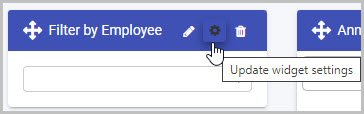
On your dashboard, click on the Edit current page button
in the top menu to go into Dashboards Edit mode. -
Click on the Update widget settings (Cog) button
 .
.
-
The Edit widget dialog box will open, enabling you to make changes to any of the available options (the same options as were available in the Add widget dialog box discussed in Step 4 of How to get started).
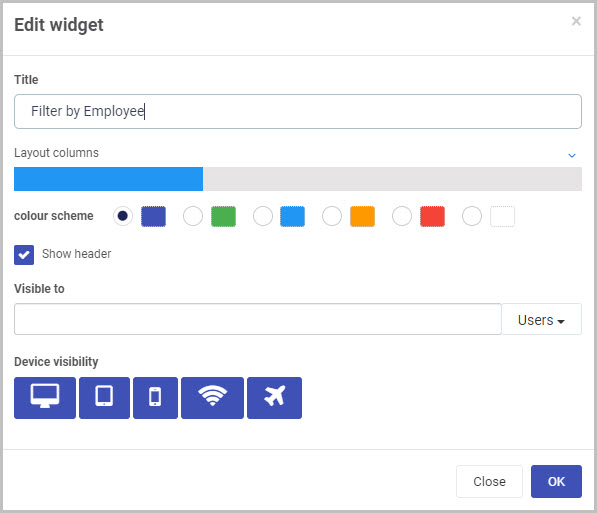
In our example, we could choose to reduce the width of the Filter widget to be 4 columns wide, by clicking to the left of the existing blue bar.
-
Click on OK to confirm the changes you’ve made to the widget settings (or click on Close if you don’t want to retain any changes).
-
The updated Filter widget will display on your dashboard. Click on Save
in the dashboard top menu to save the changes you’ve made.
Saving changes
Make sure to save any changes you make to your Filter widget by clicking on the Save button in the dashboard top menu. If you leave the dashboard without saving the changes you have made to a widget, the next time you visit the dashboard it won’t include any of the changes made to it since the dashboard page was last saved.
What’s next 
Now that you’ve learned about the Dashboard Filter widget, find out more about the other types of Dashboard widgets you can add to your Kianda dashboard:
- Chart widget
- Link widget
- Rich Text widget
- List widget
- Tile widget
- Walkthrough widget
- Custom dashboard widget
Feedback
Was this page helpful?
Glad to hear it! Please tell us how we can improve.
Sorry to hear that. Please tell us how we can improve.