Custom widget debugging
Introduction
Within your Kianda platform, you have the option to create your own custom widgets if the many pre-configured fields, rules or dashboard elements do not suit. Naturally, you might want to troubleshoot your created code if it does not perform as expected. This page will outline and detail several important code debugging practices you can implement in your custom widget to ensure correct operation. As well as this, some of these methods can be applied to troubleshoot your own custom connectors within your platform.
Prerequisites
Before getting started, open a custom widget of your choice in code edit mode within Kianda Developer. For example choose features within rule, field, dashboard elements that require debugging.
Custom widget debugging practices
There are several methods of debugging your custom field, rule, and dashboard widgets listed below. You can also investigate and understand Ember.js on your Kianda platform via the Ember.js inspector, an an open-source JavaScript web application framework that allows you to build highly interactive applications that use JavaScript in a quick and efficient manner.
On this page, we will look at using Google Chrome Developer Tools, however most web browsers provide web analysis and debugging tools such as Mozilla Firefox Developer Tools and Safari Web Inspector.
Developer console
You can simply print information relating to your widget within the developer console by utilising JavaScript methods such as getElementsByClassName on the document object. Depending on the code you have written, this method can be useful in returning attributes of your chosen array of classes.
To print debugging messages to the console:
-
Navigate to a process that features the custom field or rule you would like to troubleshoot, or alternatively in this case, navigate to the dashboard that features the custom dashboard widget you would like to troubleshoot.
-
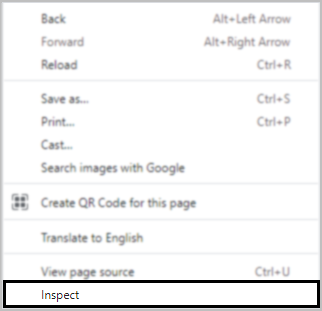
Right click on the page and select Inspect.
-
Within the developer tools window, click on the Console tab. From here you can write various queries and debugging snippets that can aid in the troubleshooting process.

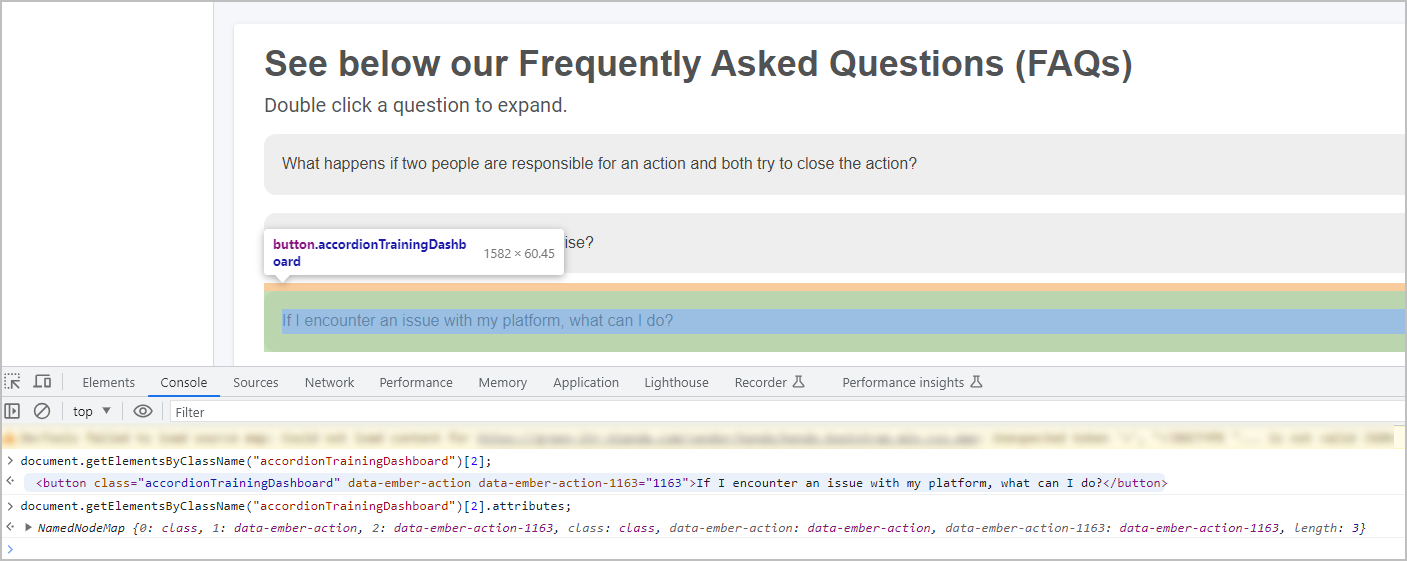
In this example, we are looking at a custom dashboard widget that features a frequently asked questions (FAQ) accordion. Each question division has the class name of accordionTrainingDashboard, so to obtain the attributes of each division, we query a chosen index of the array of divisions and add the .attributes element to the end:
document.getElementsByClassName("accordionTrainingDashboard")[2].attributes;

> NamedNodeMap {0: class, 1: data-ember-action, 2: data-ember-action-1163,
    			class: class, data-ember-action: data-ember-action,
                data-ember-action-1163: data-ember-action-1163, length: 3}
This code displays various attributes relating to the third question in the FAQ accordion, however other properties and methods can be called in the developer console instead of .attributes:
- .style - to view the custom CSS that is being applied to the HTML. For more on this, see Global CSS File.
- .focus() - if your HTML elements appear to be hidden or out of focus, the .focus() method snaps the browser view to the elements position.
- .innerHTML - returns the HTML content within the selected element, useful for analysing and manipulating content.
Console.log() method
The console.log() method is a useful JavaScript method that prints out values that are passed into it as a parameter. This is useful for troubleshooting logical problems within your code at any point to ensure the correct operation of your widget.
For example within a custom field widget’s actual source code, you might want to confirm the value of a file URL field by adding a console.log() statement after the variable is declared and initialised:
var fileURLField = process.findFieldByName(this.get("rule.settings.fileURL.name"));

console.log(fileURLField);

fileURLField.set("text", "https://xyz.kianda.com/api/file/kianda-data/?file="+sourceField.data.value[0].fileUrl);
In this example, the URL will be printed to the developer console before calling the .set method to it to ensure the correct URL is being set.
Debugger function
The debugger function is a JavaScript function that allows for troubleshooting your code in a step-by-step process using code breakpoints. When the debugger function is called, any values that were declared and initialised, or any calculations that were made will be highlighted and displayed in the developer tools tab Sources.
To use the debugger function:
-
Navigate to a process that features the custom field or rule you would like to troubleshoot.
-
Right click on the page and select Inspect.
-
Within the developer tools window, click on the Sources tab.

-
From here, execute your code/begin entering data into your custom widget.
As seen in the image below:
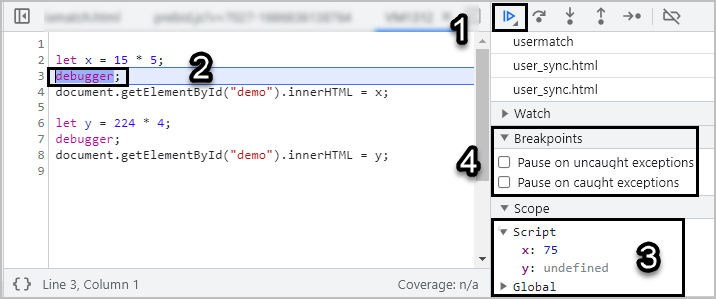
- Clicking on the Play/pause button will begin executing the code.
- The code execution pauses when it reaches the debugger function. If you would like to execute the code until the next debugger function, click on the Play/pause button again.
- The values/calculations are displayed under the Script heading in the bottom right-hand corner and will be updated on each iteration.
- You can choose to select further code Breakpoints by ticking the checkboxes beside Pause on uncaught exceptions and Pause on caught exceptions.
The debugger function operates similarly to the Rule debugger with its iterative, step-by-step stage based troubleshooting flow.
Other debugging practices
There are several other useful debugging practices you can implement within your Kianda platform:
- Console.error() - this method similar to console.log() outputs an error message to the developer console with a red warning symbol.
- Try - catch statements - you can wrap your code in a try - catch block so that expected errors are handled appropriately. This is a preventative measure for certain scenarios such as a user entering invalid data.
- Other developer tools like:
- Network tab to monitor and analyse network activity between the client and server - useful for investigating bottlenecks and throttling such as uploading large files. Throttling is described as intentionally slowing down your network speed to imitate scenarios where a poor network connection might occur.
- Elements tab allows you to inspect the nested HTML structure of your page and visualise any applied CSS styles, as well as allowing manipulation via the box model visualiser.
- Performance tab showcases JavaScript execution, memory usage and more. It differs from the network tab in that it analyses overall performance as opposed to specific requests.
What’s next 
Now that you’ve learned about the Custom widget debugging, find out more about other troubleshooting features:
Feedback
Was this page helpful?
Glad to hear it! Please tell us how we can improve.
Sorry to hear that. Please tell us how we can improve.