Rule debugger
Introduction
The Rule debugger is a troubleshooting feature that allows you to visualise each rule being executed in your process design within the preview window. It provides an insight into the logical flow of a process and serves as an important troubleshooting feature if your process does not work as expected. As well as this, it states what rule is being executed and on what field it is acting upon, alongside any associated conditions.
The Rule Debugger can be turned on at any point, for example when starting a new process or using the Previewer. We look at the Previewer in the steps below, however you can also access this feature via Rule diagnostics.
Prerequisites
Before getting started, you must open a process design of your choice that features rules that require debugging.
How to get started
To access the rule debugger feature:
-
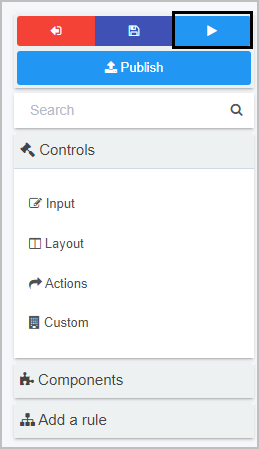
Navigate to the left-hand pane of the designer screen and click on the Run and preview process button
 .
.
-
In the preview window, click on the Enable / Disable Rule debugging button
 in the top right corner of the window.
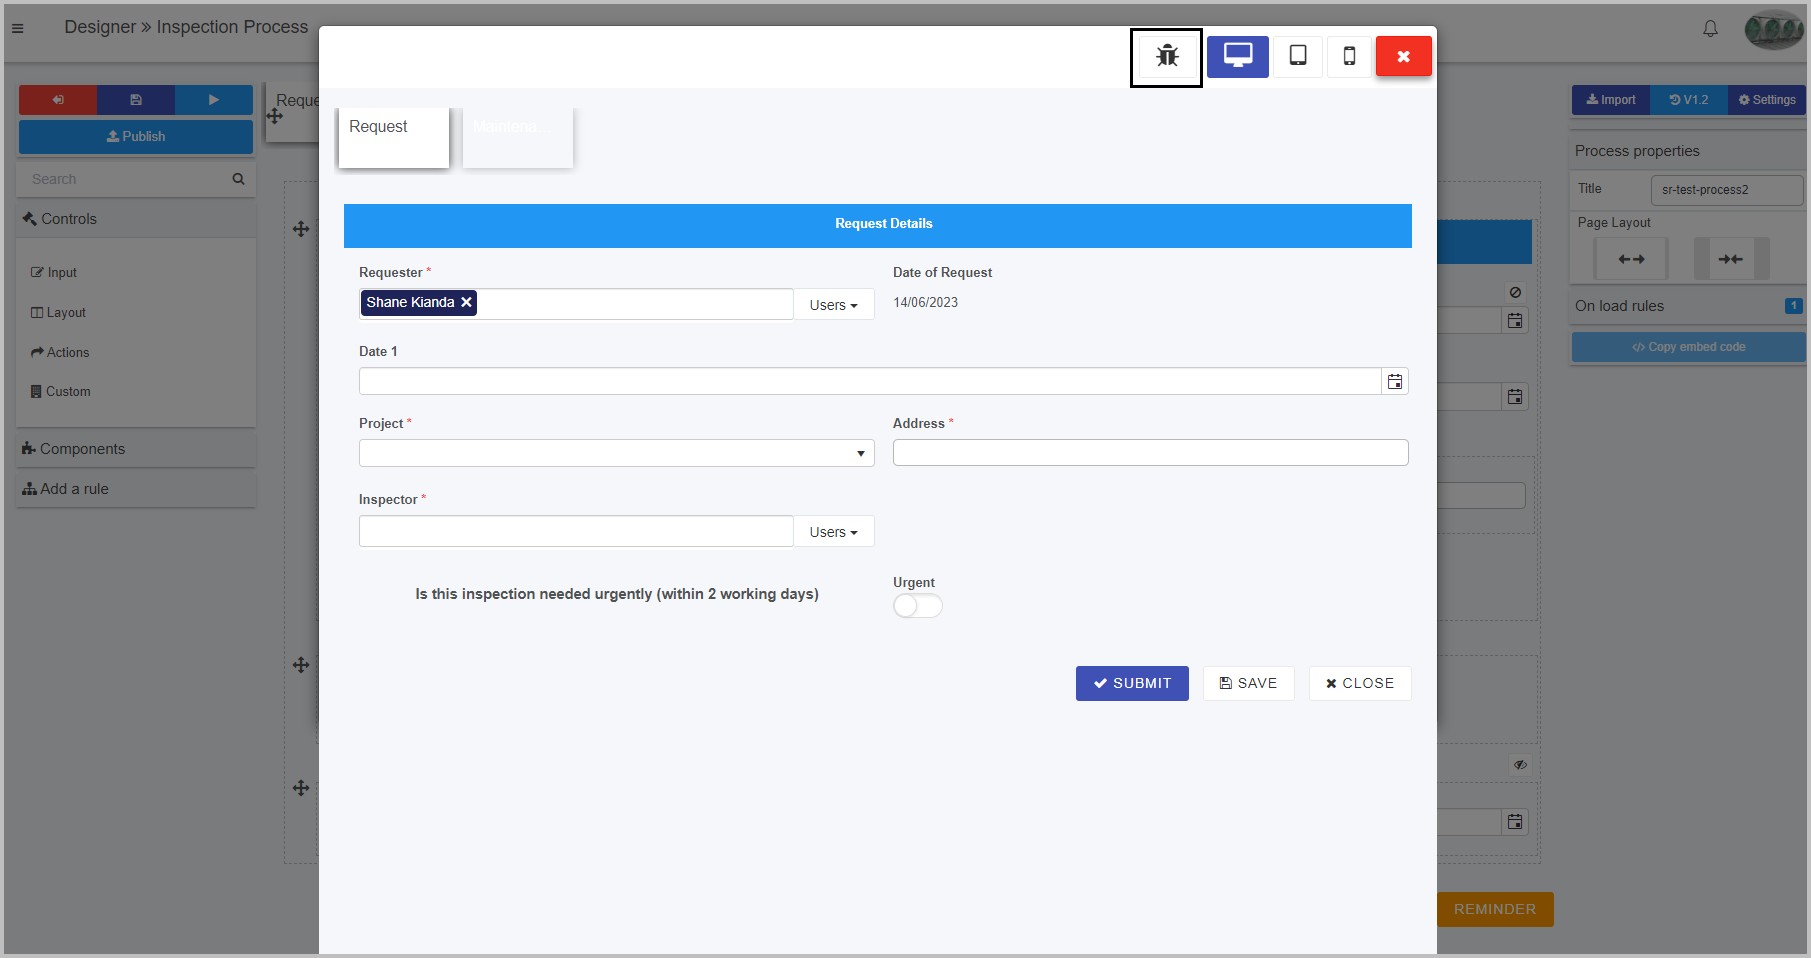
-
Begin entering data into your process as expected until the rule debugger modal dialog appears in the bottom right of the preview window. This appears as soon as the first rule is encountered in the design’s logical workflow.
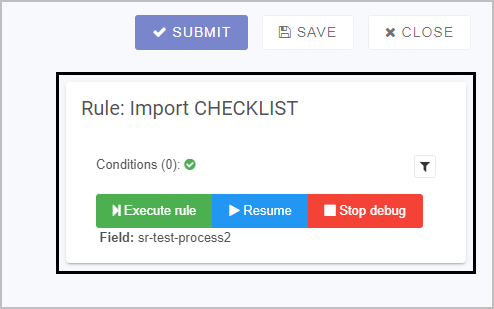
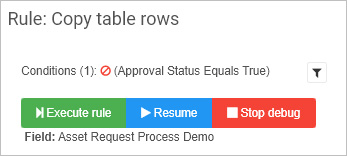
The rule debugger dialog displays information such as the Rule currently being executed, any Conditions associated with the rule and the Field the rule is being enacted upon. Three buttons are also displayed, allowing you to:
- Execute rule - executes the currently displayed rule on the currently displayed field, along with any conditions specified where you have two or more rules attached to a field, form or process. Once all the rules are executed for that field, then the dialog box will disappear and the system awaits further data input into the form’s fields until the next rule or block of rules attached to a field are met.
- Resume - resumes the execution of all rules in a block where there are two or more rules attached to a field, form or process. The rule debug dialog will only then reappear when new data is entered into another field in the process flow.
- Stop debug - exits the debugging mode and the rule debug dialog box disappears. You will not receive messages about current rule execution, but will remain in the process preview window.
-
You can alter the conditions on the currently displayed rule (if any), by clicking on the Conditions filter button
 . This will display another modal dialog box, which gives you the option to change the condition being applied to the rule, add further conditions, remove some conditions and more - allowing for the troubleshooting of different use cases within your process. To learn more about this, see Conditions.
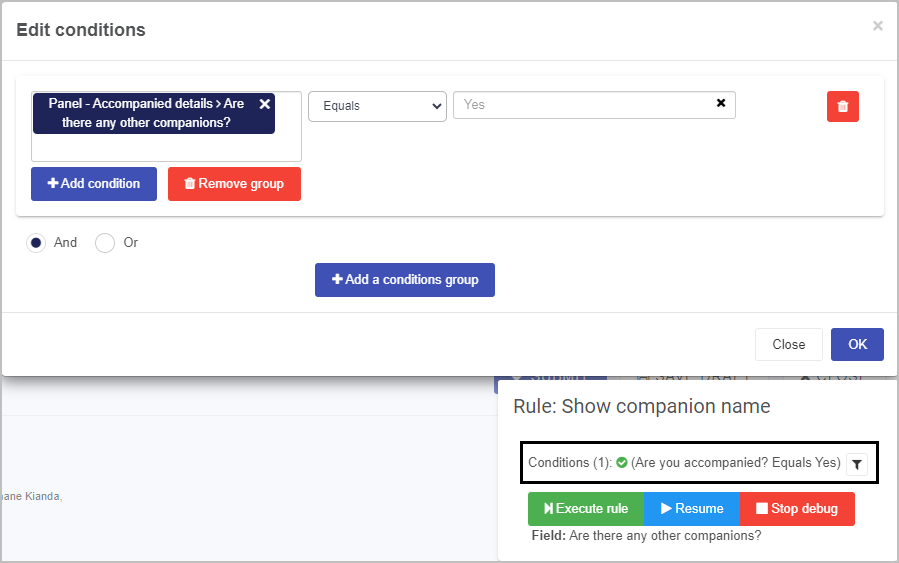
To exit the debugging process, you can click on the Stop debug button  , or alternatively click on the Enable / Disable Rule debugging button , or click on the Exit preview mode button
  .
.
What’s next 
Now that you’ve learned about the Rule debugger, find out more about other troubleshooting features:
Feedback
Was this page helpful?
Glad to hear it! Please tell us how we can improve.
Sorry to hear that. Please tell us how we can improve.