Rule diagnostics
Introduction
Rule diagnostics is a troubleshooting feature within Kianda that allows you to view a nested list of all forms, fields and rules - the purpose being that you can choose to manually trigger these rules for diagnostic purposes, as well as toggle field visibility, re-assign forms, and more.
The rule diagnostics feature is available for troubleshooting specific Process instances where as the Rule debugger feature focuses more so on troubleshooting a process design pre-publishing.
Prerequisites
Before getting started, you must open a process instance that you would like to perform rule diagnostics on.
How to get started
To access the rule diagnostics feature:
-
On your chosen process instance, click on the Process history button
 in the top right-hand corner of the screen. This will open the Process history modal dialog box.
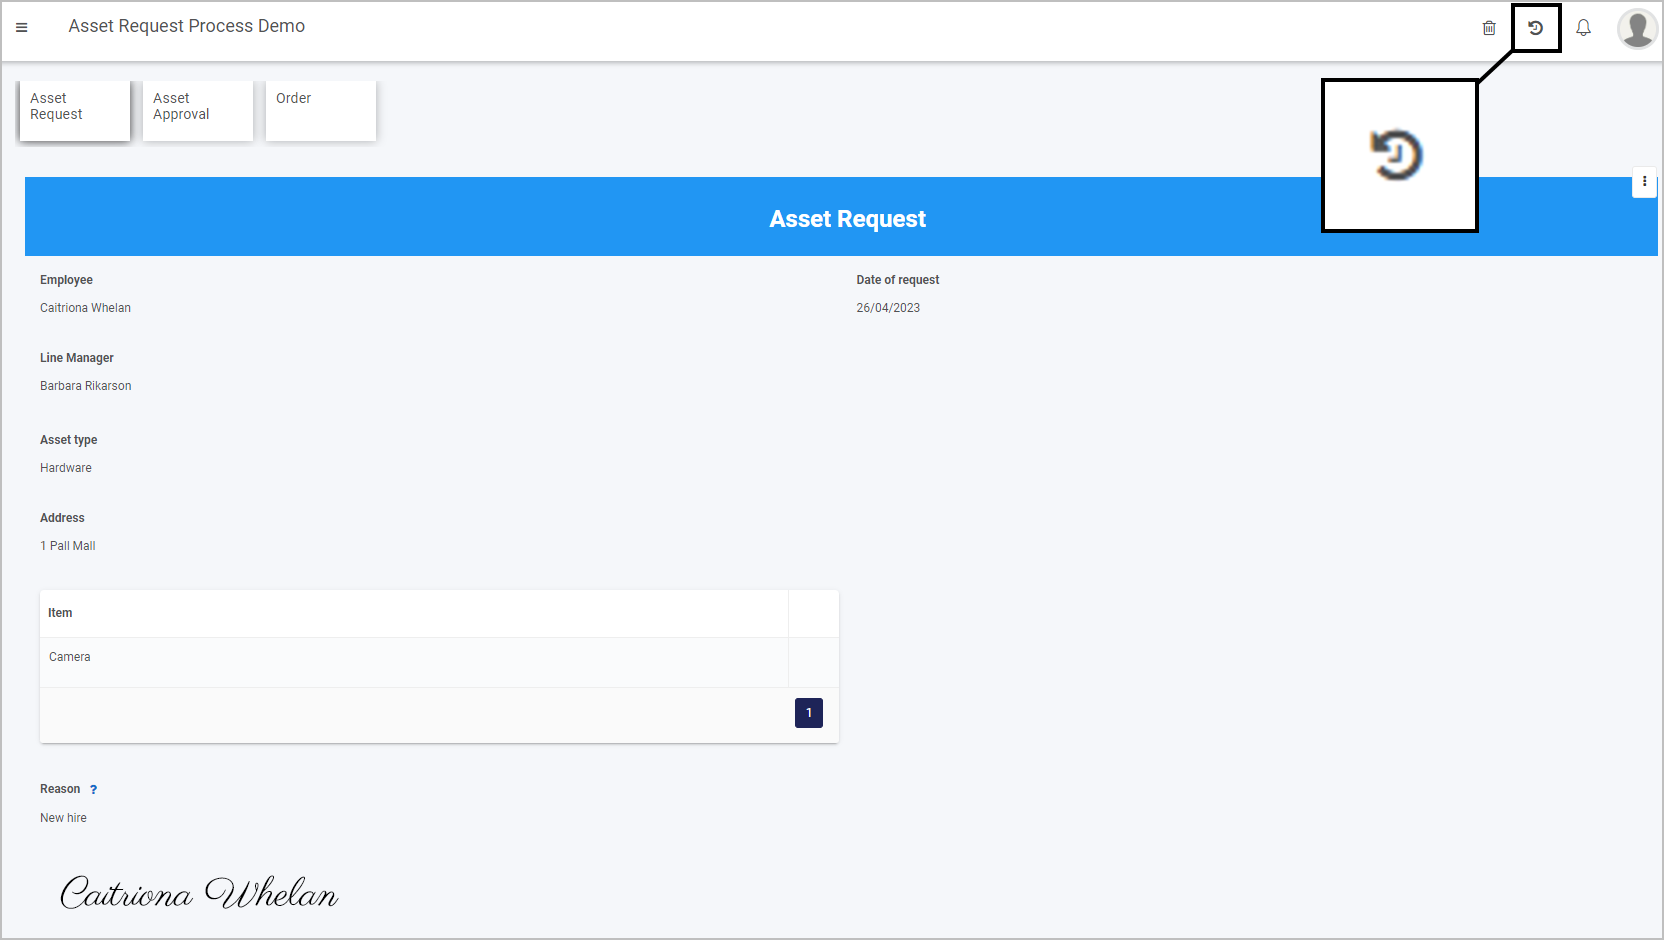
-
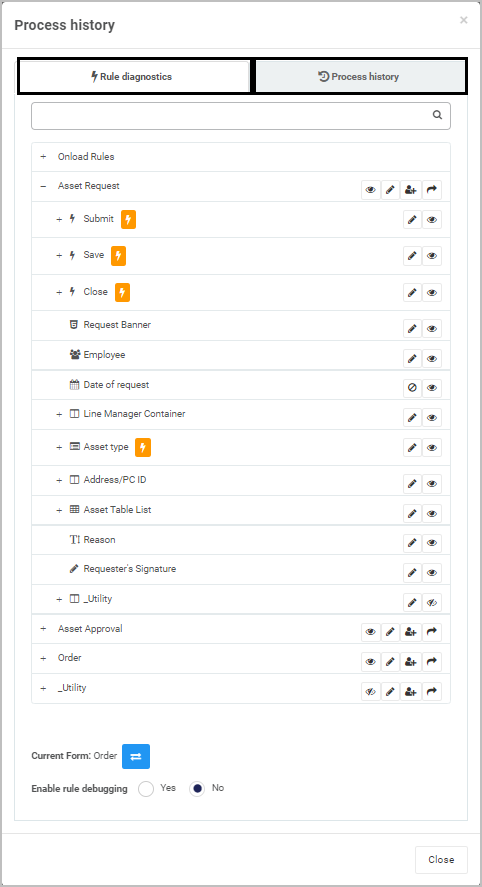
On the process history dialog, navigate to the Rule diagnostics tab. From here, you can view a nested list of all forms, fields and rules. In the example below, you can view rules and fields across three different forms in the process, as well as expand the onload rules. You can search for a specific element in your process by utilising the search bar.
-
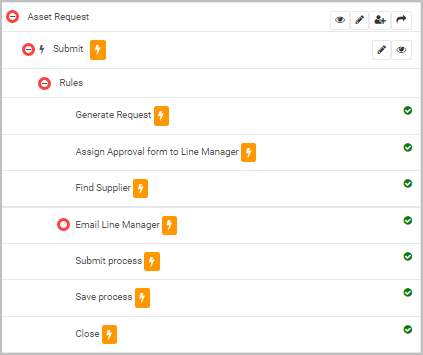
There are many possibilities for testing your process instance, however in this example we will try to troubleshoot the Send email rule to ensure that the line manager receives the correctly formatted email during this process.
To do this, we will drill down into the following path: Asset request form > Submit button > Rules > Email Line Manager.
-
Beside the Email Line Manager rule, click on the orange Trigger bolt button
 to manually trigger the rule. This is a powerful feature as you do not need to fill out an entire process from start to finish to troubleshoot this. You will then see a Rule executed alert at the top of the page, and the specific rule should perform as expected.
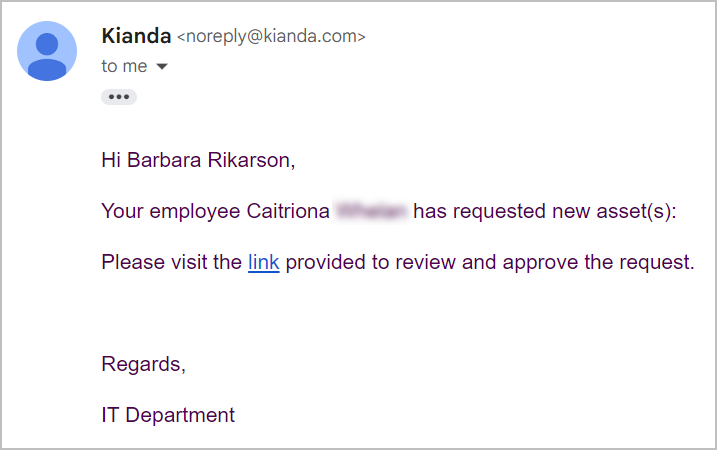
-
There are other features you can troubleshoot in the Rule diagnostics tab such as clicking:
- Toggle form visibility button
 - to hide or show the selected form
 - Make editable button
 - make the current field/form editable
 - Re-assign form button
 - to assign the form to a different person
 - Go to form button
 - snaps to the selected form
 - Toggle field enable button
 - to enable/disable the selected field
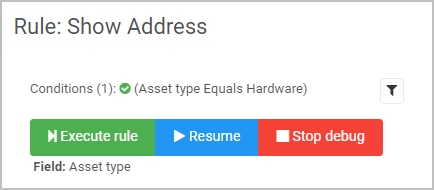
As well as this, the Rule executed status can be seen beside each rule - a green tick
 for executed, and a grey tick
  for not executed.
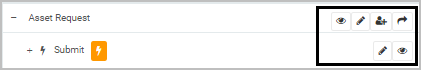
- Toggle form visibility button
-
To change the current form in your process instance, you can click on the Change current active form button
 below the form list. This will allow you to troubleshoot different forms and how they behave when changed to the active form in the process.
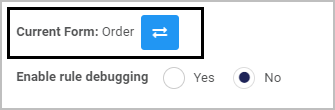
-
You can also choose to Enable rule debugging by choosing the Yes radio button, also below the nested list. This will enable the Rule debugger feature, however instead of executing within a process design preview window, it will enact upon your selected process instance. The rule debugger modal dialog will appear in the bottom right-hand corner of the screen.
-
When finished troubleshooting, click the Close button to close the process history dialog box.
What’s next 
Now that you’ve learned about the Rule Diagnostics, find out more about other troubleshooting features:
Feedback
Was this page helpful?
Glad to hear it! Please tell us how we can improve.
Sorry to hear that. Please tell us how we can improve.